Reverse Engineering for Beginners :1.11 printf() with several arguments (CH1.11) {Part1}

printf() with several arguments
The author brought an example from the old examples, he only changed the printf() to be inside main():
1.11.1 x86

When we compile this code using MSVC 2010 Express we will find the output like this:
We will take this one step at a time to make things easier:
1 -
This is the string itself that printf will print, and the compiler placed it in memory under a label called $SG3830.
As we know from before.
2 -
I will explain this simply.
Here printf needs 4 arguments, which are:
- The address of the string
- Number 1
- Number 2
- Number 3
But of course, as we discussed earlier, it pushes in reverse — meaning it starts pushing number 3 up to pushing the address of the string.
So the actual order will look like this:
3
2
1
address_of_string
By the way, variables of type int in a 32-bit environment are 32-bit in size, i.e., 4 bytes.
So we have 4 arguments here.
4 × 4 = 16 — and that is exactly the size they occupy on the 32-bit stack (the string pointer + 3 ints).
After the function finishes, the stack must be cleaned up (stack cleanup).
So we use:
add esp, 16
This means, as we saw above, the function had 16 bytes of arguments.
If you divide them by 4, you get the number of arguments:
16 / 4 = 4 arguments
Of course this applies only to a calling convention named cdecl and also only in a 32-bit environment.
The author said something very important which is:
If there are several calls one after another:
call A  (1 arg)
call B  (0 arg)
call C  (3 args)
Instead of doing:
add esp,4
add esp,0
add esp,12
It will add them all together into:
add esp, 16
Which is faster and better.
And here is a real-life example:
push 3
call sub_100018B0 ; takes one argument (3)

call sub_100019D0 ; takes no arguments

call sub_10006A90 ; takes no arguments

push 1
call sub_100018B0 ; takes one argument (1)

add esp, 8 ; removes two arguments that were on the stack
MSVC and OllyDbg
The author downloaded OllyDbg because at that time it was the best Win32 debugger.
Note:
I want to say something: since OllyDbg is not working nowadays or is not very well known at present, I will do the explanation on the well-known x32dbg program and it will be different from the book's method a bit but it will be the same explanation so that whoever tries it after me will find it easier.
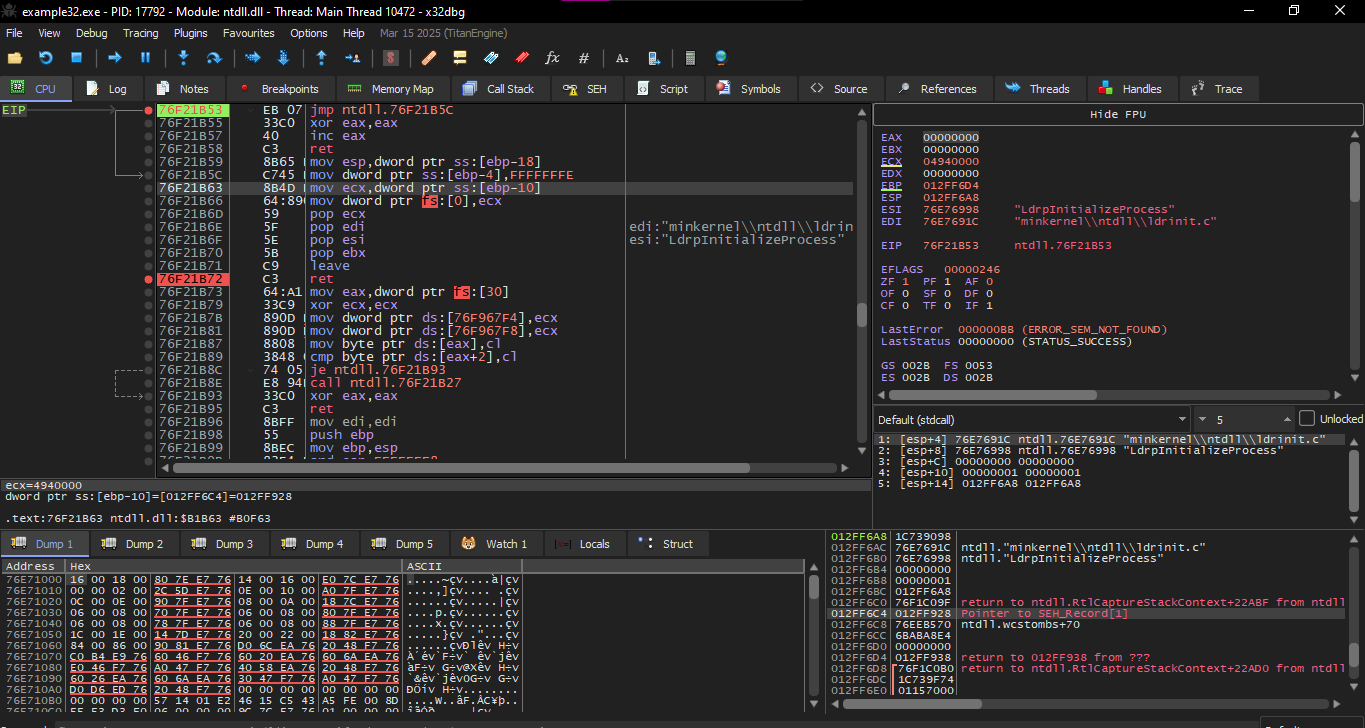
Initially after I made the C code and converted it to an EXE file I opened it in x32dbg and the first thing it stopped me at was the first Breakpoint which will be at ntdll.ll
As soon as you press F9 it will take you to the second Breakpoint which will belong to the CRT-code.
Because I didn't find it easily, I'll tell you what to do:
Go to Symbols and you can also go by the shortcut: CTRL + ALT + S
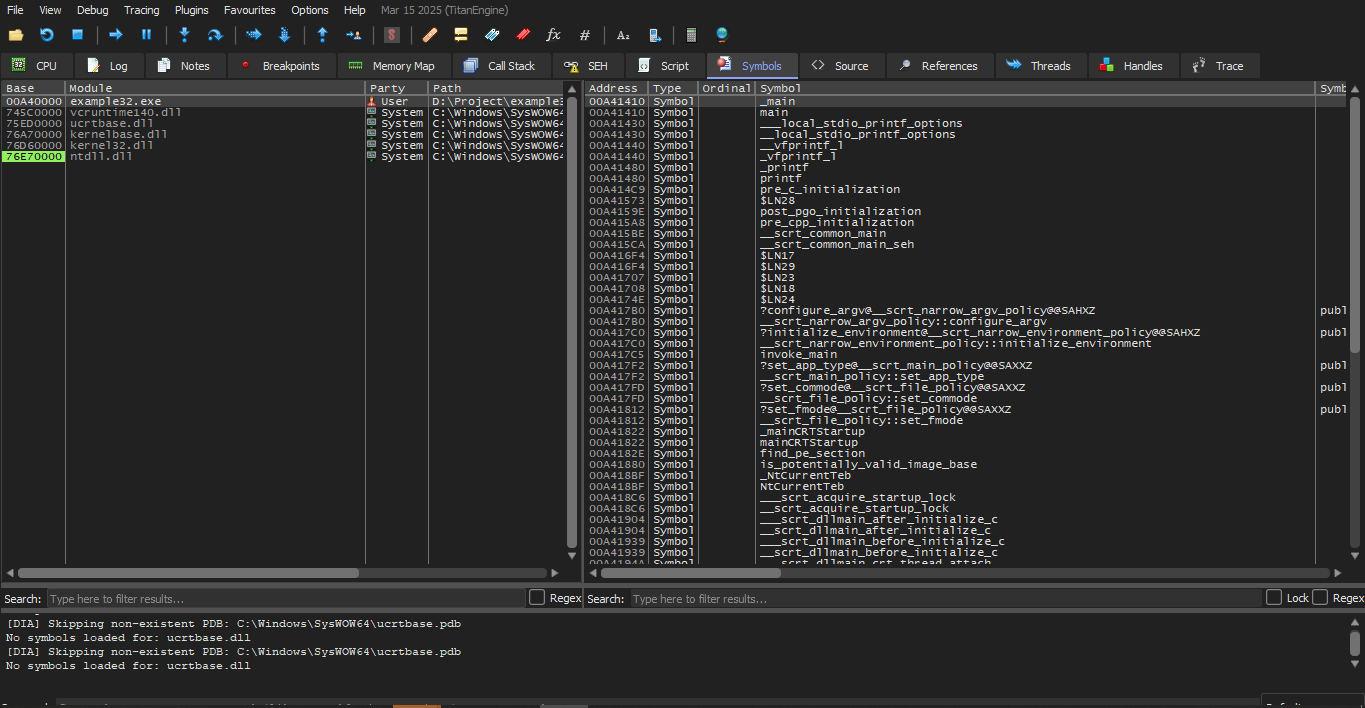
Click on the program name (I named mine example32.exe), then on the other side you will find main, click it and the code will appear.
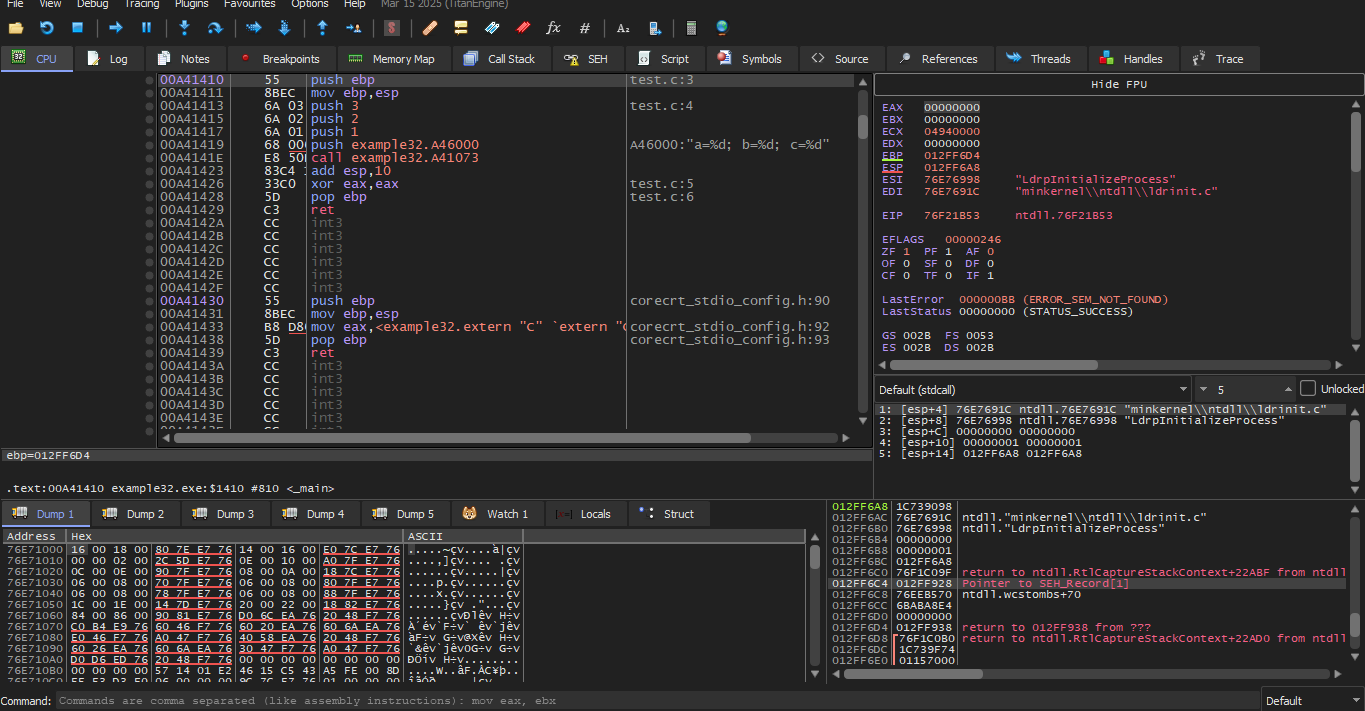
We will press on the PUSH EBP instruction and set a Breakpoint with F2 then press F9 to Run — we must do these steps to skip the CRT-code because we are not interested in it now.
Press F8 (step over) 6 times — i.e., skip 6 instructions.
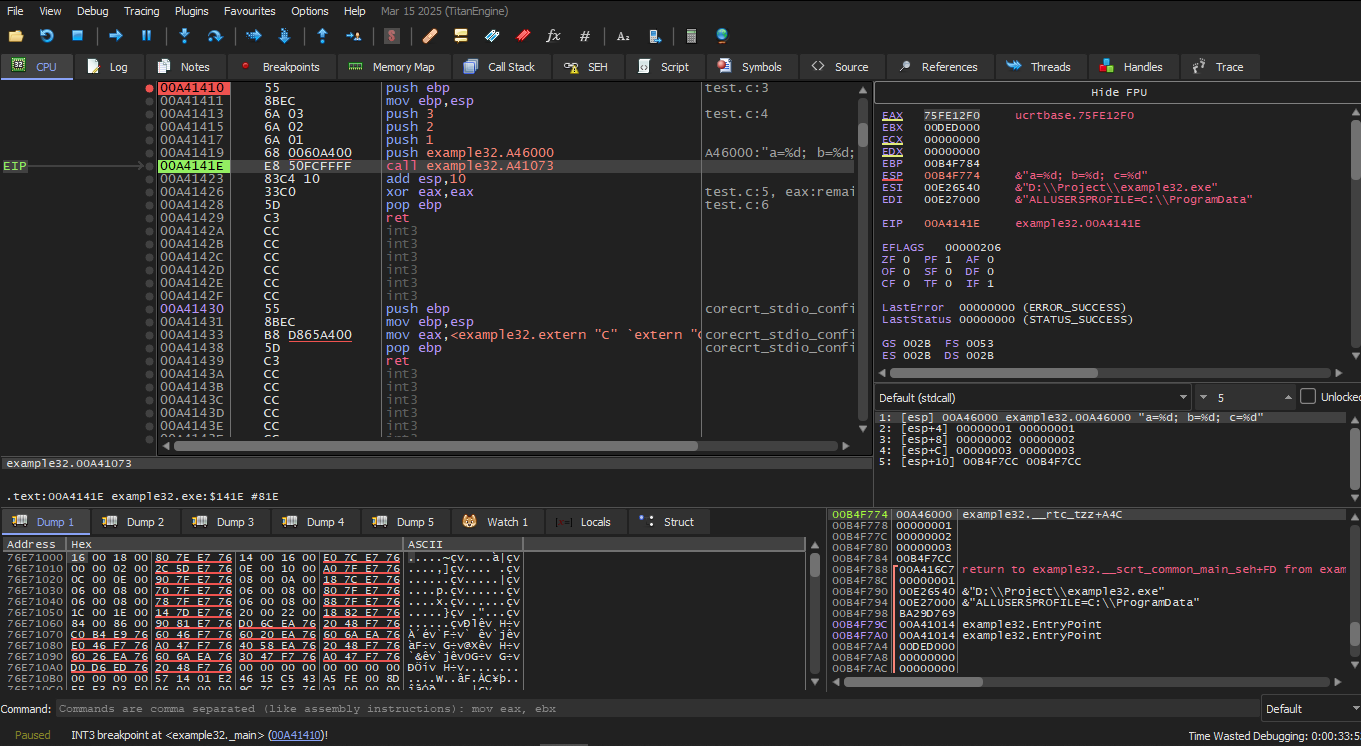
Now the PC points to the CALL printf instruction. Like other debuggers, it highlights the values that changed in the registers. So each time you press F8, the EIP value changes and appears in red. ESP also changes, because the argument values are being pushed into the stack.
Here we monitor the Stack and we will find it like this:
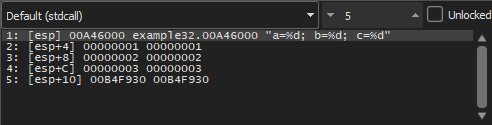
And that it indeed pushed 1 at ESP+4 and so on.
After we execute the instruction ADD ESP, 10:
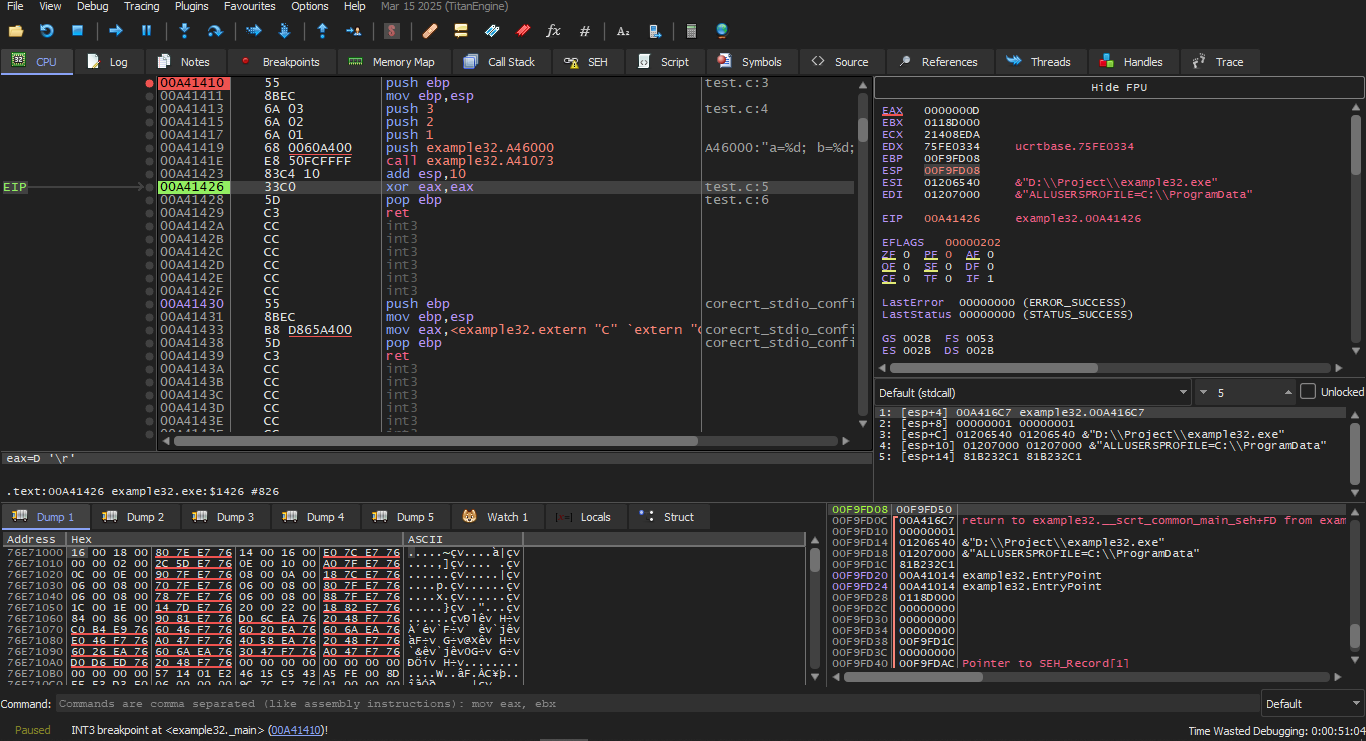
ESP changed, but the values are still present in the stack! Yes of course; nobody needs to zero those values or do anything to them. Anything above (SP) is considered noise or garbage and has no meaning. Also cleaning the stack would take time, and nobody needs it at all.
GCC and GDB

We will use the same example but using GDB on Linux. The option -g tells the compiler to add Debug Information inside the executable file.
Setting a Breakpoint on printf()
After that we run the program:
GDB says that there is no printf.c source because it is a system file, so it does not exist with us.
Next we will display the first 10 stack elements, and the first column on the left contains the addresses on the stack.
The first element is RA (0x0804844a).
We can confirm this using the disassembly at that address:
These two XCHG instructions are idle instructions; they are something very similar to a NOP.
The second element (0x080484f0) is the address of the string:
The three elements after that (1, 2, 3) are the arguments for printf().
The rest may be “garbage” on the stack, or values from other functions or local variables... we ignore them now.
Finsh
This command makes GDB execute all the instructions until the end of the function.
In this case: until the end of printf().
GDB shows that printf() returned the value 13 in EAX.
This is the number of characters that were printed… like the OllyDbg example.
And we also see “return 0;” and the information that this line exists in file 1.c at line 6.
Indeed the file exists in the current directory, and GDB found this line in it.
How does GDB know which C line is being executed?
Because the compiler, while generating the debugging info, stores a mapping table between the source code lines and the instruction addresses.
GDB is a source-level debugger.
Checking the Registers
Now we will disassemble the current instructions.
The arrow points to the next instruction that will be executed:
Changing Syntax to Intel
step
So we look at the registers after executing:
mov eax, 0
We find:
x64: 8 integer arguments
To see how the rest of the arguments are passed on the stack, we increase the number of parameters to 9 (format string + 8 ints):
MSCV

As we said before, the first 4 arguments must be sent via the RCX, RDX, R8, R9 registers in Win64 and the remainder is passed via the stack — and this is exactly what we see here. But the MOV instruction, instead of PUSH, is used to prepare the stack, so the values are stored directly on the stack.
The question now: why are 8 bytes allocated for int values even though 4 bytes are enough?
Yes, we must remember: 8 bytes are allocated for any data type smaller than 64-bit. This is done for convenience: it makes calculating the address of any argument easy. Also, they are all stored at properly aligned memory addresses (aligned). The same applies in a 32-bit environment: 4 bytes are reserved for each data type.
GCC
The picture will be similar on x86-64 *NIX systems, except that the first 6 arguments are passed via the registers: RDI, RSI, RDX, RCX, R8, R9, and the rest are passed on the stack. GCC generates code that stores the string pointer in EDI instead of RDI — and we noticed that before.
And also we had noticed before that the EAX register is cleared before the printf() call.
Listing 1.50: Optimizing GCC 4.4.6 x64
GCC + GDB
Let's try this example in GDB.
$ gcc -g 2.c -o 2

$ gdb 2
GNU gdb (GDB) 7.6.1-ubuntu
...
Reading symbols from /home/dennis/polygon/2...done.
RSI/RDX/RCX/R8/R9 registers contain the expected values. RIP has the address of the first instruction in the Let's look at the format string: Let's do a stack dump using The first element on the stack, as in the previous example, is the return address (RA). There are 3 more values that were passed via the stack: 6, 7, 8. We also see that the value 8 was passed and the high 32 bits are not zeroed: This is normal, because values of type Let's continue executing (gdb) info registersb printf then
(gdb) b printf
Breakpoint 1 at 0x400410
(gdb) run
Starting program: /home/dennis/polygon/2
Breakpoint 1, __printf (format=0x400628 "a=%d; b=%d; c=%d; d=%d; e=%d; f=%d; g=%d; h=%d\n") at printf.c:29
29               printf.c: No such file or directory.
printf() function.
(gdb) x/s $rdi
0x400628:   "a=%d; b=%d; c=%d; d=%d; e=%d; f=%d; g=%d; h=%d\n"
Stack Dump (x/10g)
x/g — this time g means giant words, i.e., 64-bit words.
(gdb) x/10g $rsp

0x7fffffffdf38: 0x0000000000400576                0x0000000000000006
0x7fffffffdf48: 0x0000000000000007                0x00007fff00000008
0x7fffffffdf58: 0x0000000000000000                0x00007fff00000008
0x7fffffffdf68: 0x00007ffff7a33de5                0x0000000000000000
0x7fffffffdf78: 0x00007fffffffe048                0x0000000100000000
0x00007fff00000008.int are 32-bit. So the high part of the register or stack element may contain “random garbage”. If you look at the place the control will return to after printf() finishes, GDB will show the whole main() function:
(gdb) set disassembly-flavor intel
(gdb) disas 0x0000000000400576
Dump of assembler code for function main:
0x000000000040052d <+0>:    push    rbp
0x000000000040052e <+1>:    mov     rbp,rsp
0x0000000000400531 <+4>:    sub     rsp,0x20
0x0000000000400535 <+8>:    mov     DWORD PTR [rsp+0x10],0x8
0x000000000040053d <+16>:   mov     DWORD PTR [rsp+0x8],0x7
0x0000000000400545 <+24>:   mov     DWORD PTR [rsp],0x6
0x000000000040054c <+31>:   mov     r9d,0x5
0x0000000000400552 <+37>:   mov     r8d,0x4
0x0000000000400558 <+43>:   mov     ecx,0x3
0x000000000040055d <+48>:   mov     edx,0x2
0x0000000000400562 <+53>:   mov     esi,0x1
0x0000000000400567 <+58>:   mov     edi,0x400628
0x000000000040056c <+63>:   mov     eax,0x0
0x0000000000400571 <+68>:   call    0x400410 <printf@plt>
0x0000000000400576 <+73>:   mov     eax,0x0
0x000000000040057b <+78>:   leave
0x000000000040057c <+79>:   ret
End of assembler dump.
printf(), execute the instruction that zeroes EAX, and notice that register EAX indeed becomes exactly zero. RIP now points at the LEAVE instruction — i.e., the last instruction before the end of main().
(gdb) finish
Run till exit from #0 __printf (format=0x400628 "a=%d; b=%d; c=%d; d=%d; e=%d; f=%d; g=%d; h=%d\n") at printf.c:29
a=1; b=2; c=3; d=4; e=5; f=6; g=7; h=8
main () at 2.c:6
6                return 0;
Value returned is $1 = 39
(gdb) next
7                            };